
ARTICLE AD
Forms overview
100 XP
7 minutesThis video provides an overview of many different types of forms available in Power Apps that are used in model-driven apps.
There are different types of forms and each type has a specific functionality or use. The following table describes the types of forms available.
| Main | Used in model-driven apps, Dynamics 365 for tablets, and Dynamics 365 for Outlook. These forms provide the main user interface for viewing and interacting with table data. | Design considerations for main forms |
| Quick Create | Used in model-driven apps, Dynamics 365 for tablets, and Dynamics 365 for Outlook. For updated tables, these forms provide a basic form optimized for creating new records. | Create and edit quick create forms |
| Quick View | Used in model-driven apps, Dynamics 365 for tablets, and Dynamics 365 for Outlook. For updated tables, these forms appear within the main form to display more data for a row that is referenced by a lookup column in the form. Users can view data from related tables without having to leave the form. | Create and edit quick view forms |
| Card | Used in views for model-driven apps. Card forms are designed to present information in a compact format that is suitable for mobile devices. | Create a card form |
Form elements
100 XP
6 minutesModel-driven forms provide the means for presenting a row of detailed data to the user for editing and viewing. Forms give you a structured way to represent the data rendered for user interaction. Forms abstract the form creator from the exact rendering specifics required to transform the form definition you create for the user’s device size and capabilities. However, when you lay out the form using some knowledge of the current form rendering engine it will help you make more usable forms. Unified Interface is the name of the framework that renders the form definitions for the user. When you edit forms, the changes won't be visible to users until the form is published.
Forms are organized into header, body, and footer, each capable of containing form elements, like columns. The body of the form is further structured with areas called tabs that contain sections. Tabs and sections can be configured to support columns of form elements giving further structure to the content. The first tab on a form is the most important and should contain the priority data the user should see. While you could configure many tabs, keeping it to a smaller number with logical grouping of data can make a more usable experience because the user isn't constantly tabbing around to find things.
Table columns
The most common task you'll perform when editing a form is placing column controls on the form. Take a look at the Form designer interface to add/modify a form in your app. The form itself appears in the middle of the screen. Notice the command bar at the top where can select the + Form field. The Table columns list on the left that appears shows you which existing table columns are in your data source. You can choose to show only the columns you haven't used, or you can display all of them. On the right side of the screen, a pane contains the properties of any selected column in your form.
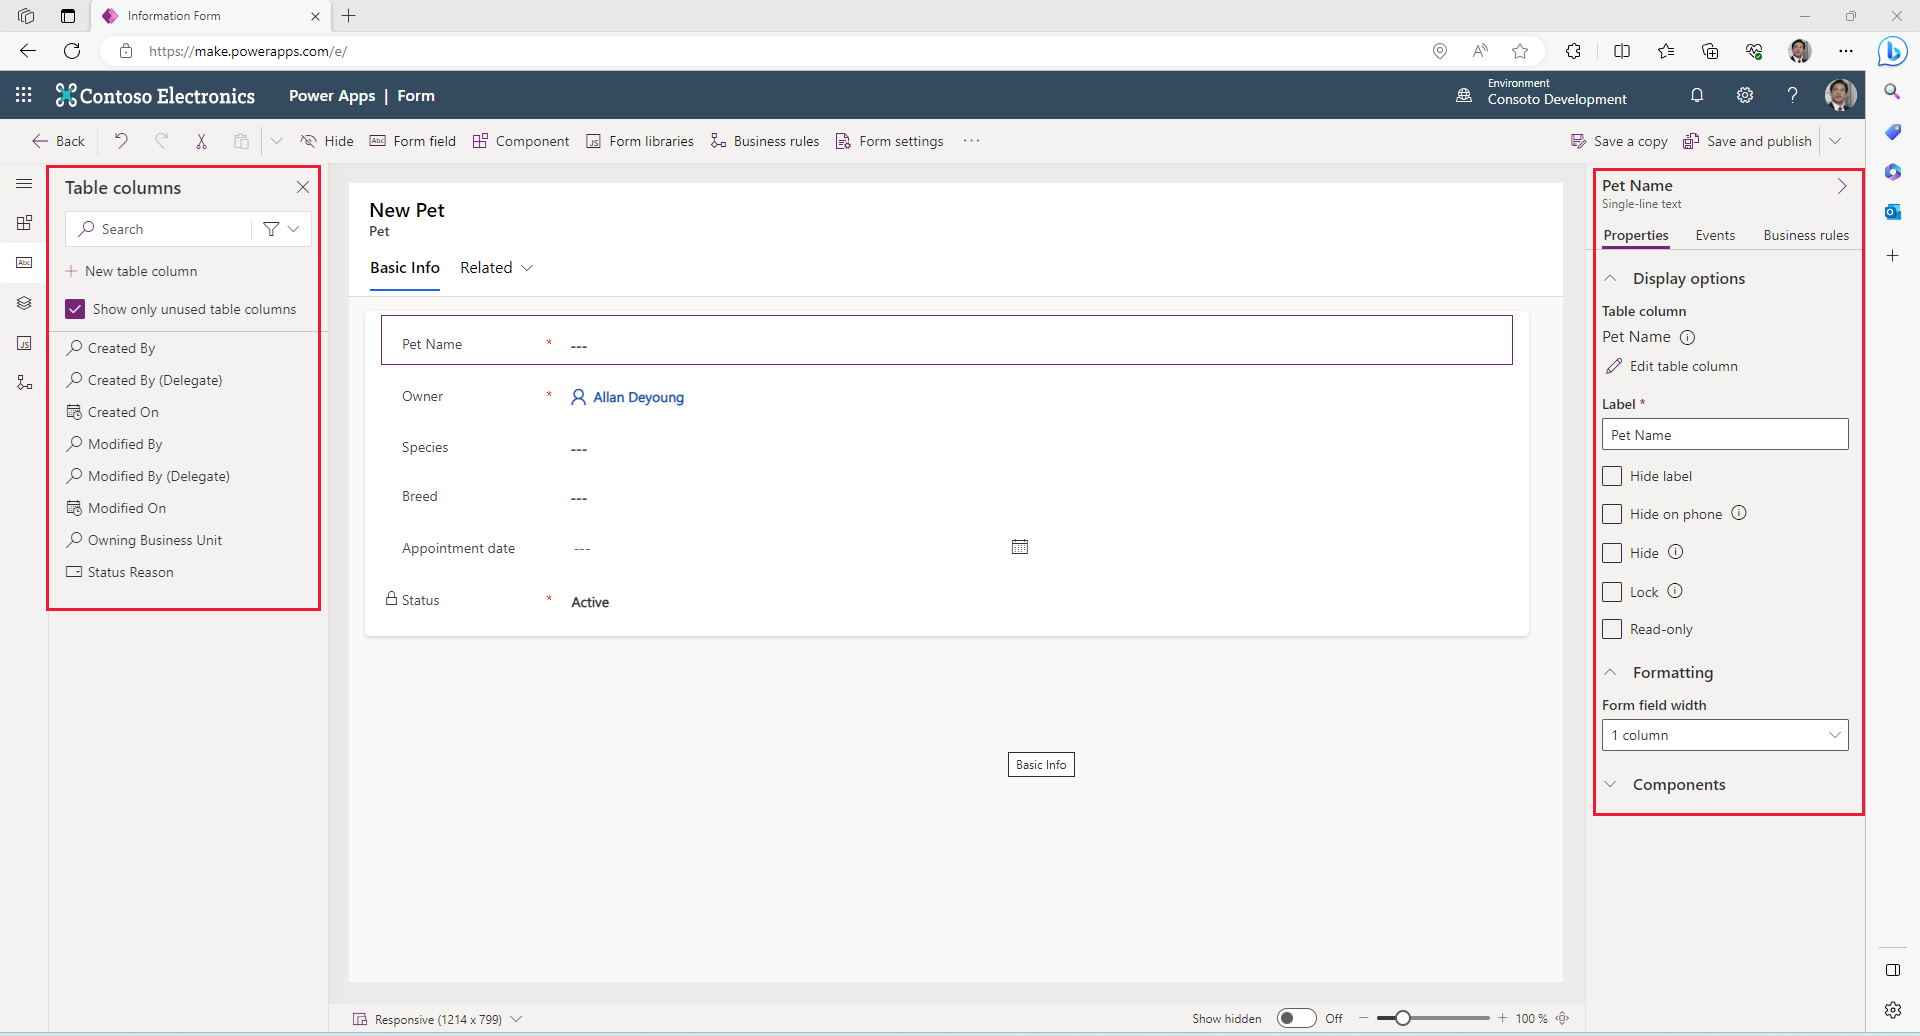
A column can be added to the form multiple times if needed, and the value shown will be the same for each occurrence. You can adjust a column's properties such as name, visibility, and read-only. Without special configuration, a column will render with a control automatically selected by the runtime that is appropriate for the data type of the column. For example, a Choice column will show the data in a drop-down list.
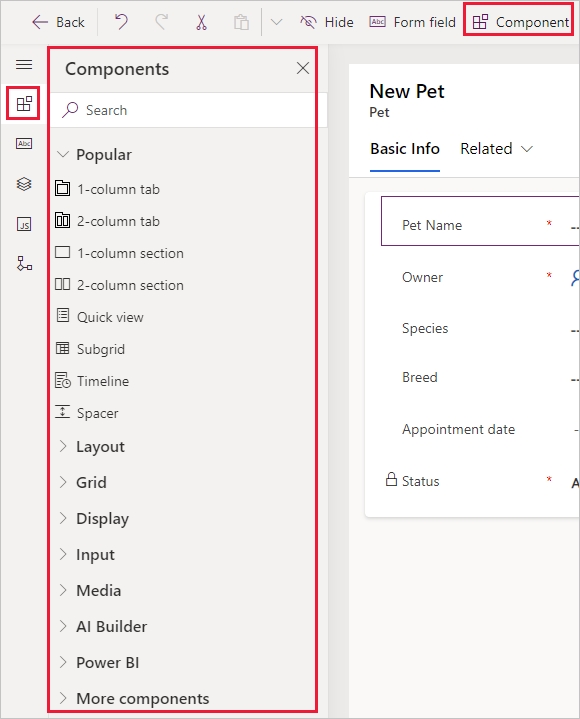
Form components
Form Components allow you the ability to further customize your form. The Layout choices provide you ways to organize the physical structure of your form. Grid components enable you to allow data entry via a grid. Display components allow you to insert calendars, external websites, Canvas apps and other items into the form experience. Input components provide your user with other means for data entry, such as checkboxes, option sets, toggles and pen inputs.
When you select a component to add, Power Apps will prompt you for which field you could apply that component to, and to annotate which platforms to display the component on. If there's no table column that you can apply the component to, you won't be able to insert it. In the example below, we've selected a Rich Text Editor Control. We're prompted to select a Table column (notice that it's a required field) and the dropdown provides us four options to choose from.
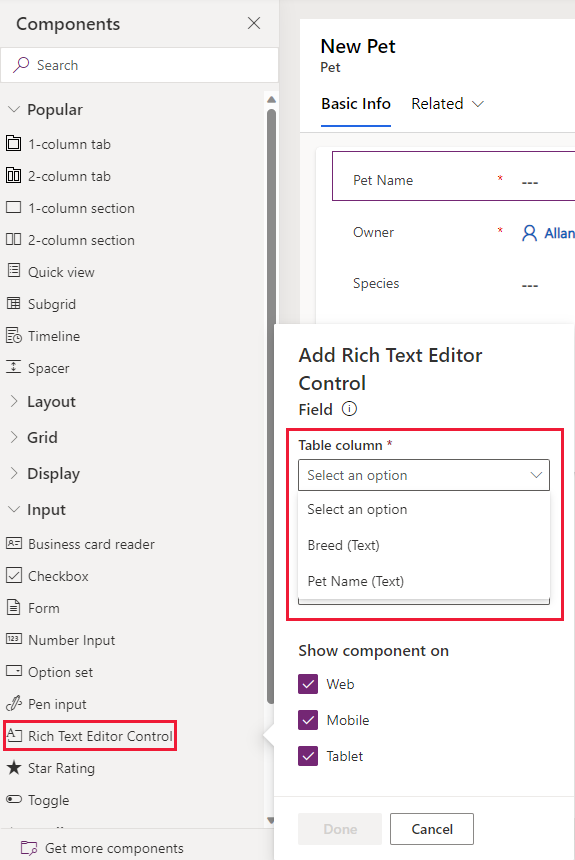
Selecting the healthcare_feedback column and selecting Done has inserted a Rich Text Editor Control tied to healthcare_feedback into our form.
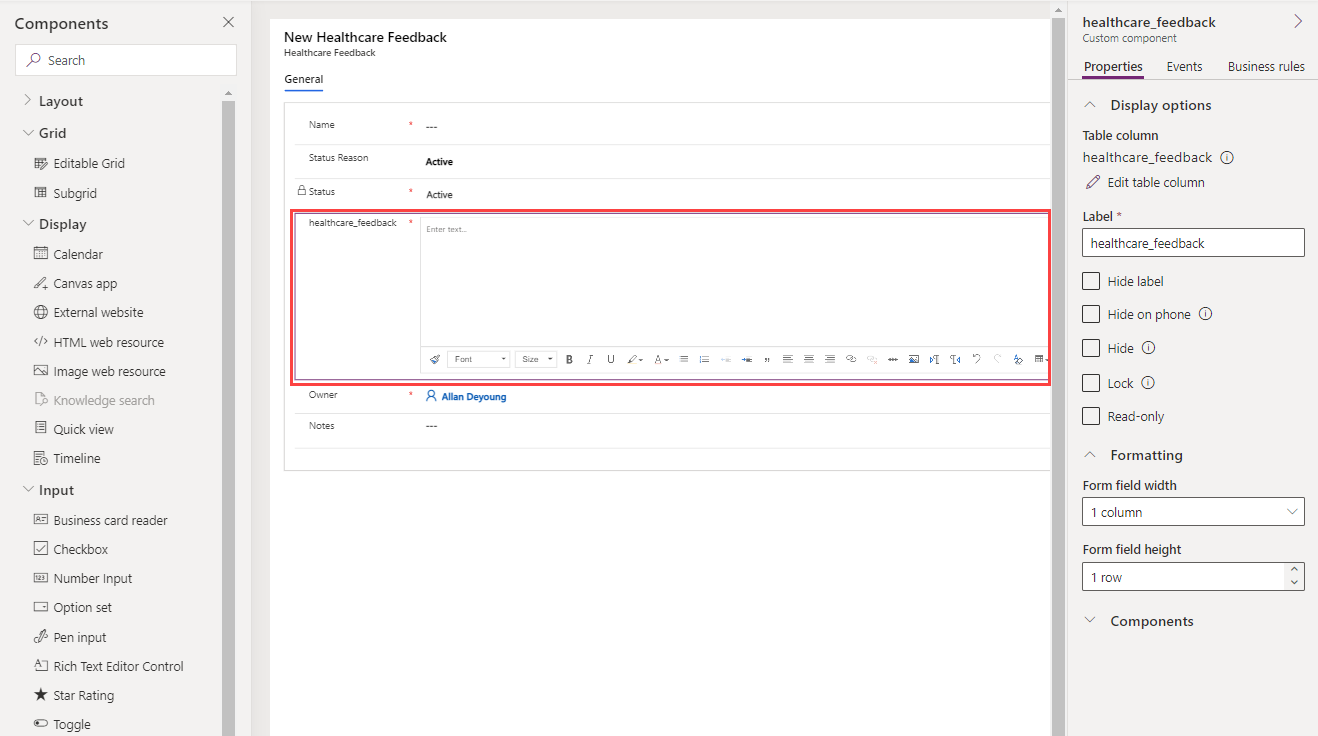
Again, the data type of the column determines what custom controls we can include in our form.
Form settings
Form settings allow us to install controls on our forms that work behind the scenes, without our user's notice. We can define security roles to the form to control access to it, the form order, and fallback forms. Additionally, Form settings provide us the ability to check a particular security group's access to the form. The image below shows the Security roles tab.
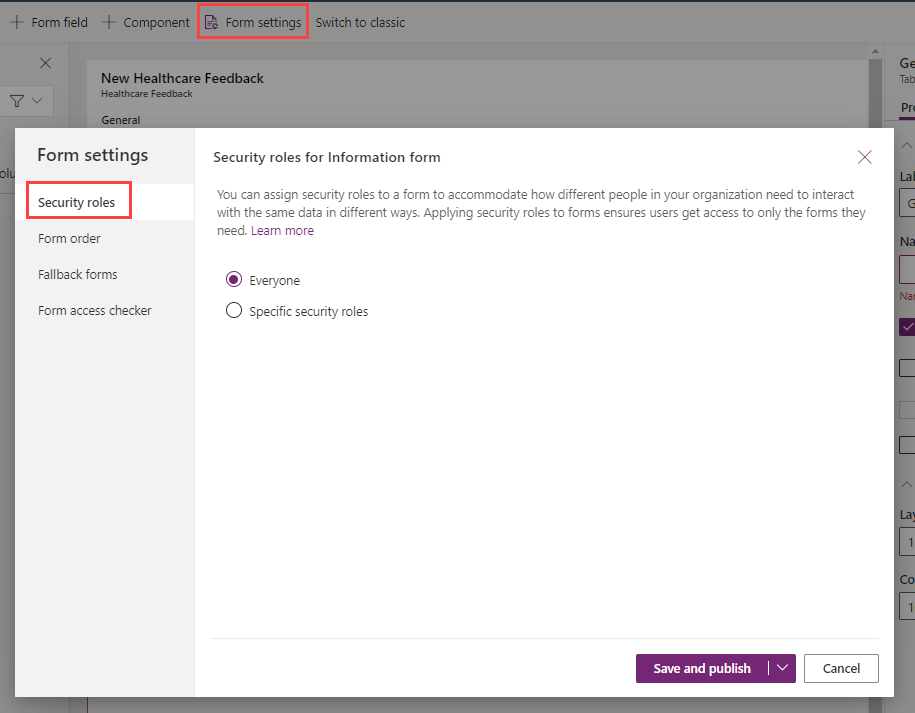
The Form order allows you to determine which form appears first and next depending on the security role. It enables you to have different forms appear for different users. *Fallback forms allow you to enable a particular form when a security role doesn't have a form selected, or vice versa. You can learn more about these settings here.
Show or hide form elements
Form elements give you the option to show or hide them, by default. This ability resides in the Properties section of each form field. Tabs, sections, columns, iFrames, and web resources all provide this option. When you use form scripts or business rules, the visibility of these elements can be controlled to create a dynamic form for user interface that adapts to conditions in the form.
Rather than designing forms that depend on scripts to control visibility options, consider whether a business rule (or switching to a different form) may be better suited to meet your requirements. If you use scripts, make sure that any element that might be hidden is hidden by default. Only show it with scripts when your logic calls for it. That way it will not be displayed in presentations that don't support scripts.
Form event handlers
Form event handlers allow configuring developer logic that runs when the user interacts with the form.
Form event handlers for forms can be configured for the following areas in a form:
| Form | OnLoad | Occurs when the form loads. |
| Form | OnSave | Occurs when data is saved. |
| Tab | TabStateChange | Occurs when the tab is expanded or collapsed. |
| Column | OnChange | Occurs when data in the column changes and the control loses focus. |
| IFrame | OnReadyStateComplete | Occurs when the content of an IFrame loads. |
An event handler consists of a reference to a JavaScript web resource, and a function defined within that web resource that will execute when the event occurs. Each element can have up to 50 separate event handlers configured.
Most of the time developers create the event handlers; however, you might want to review what is configured on your form.
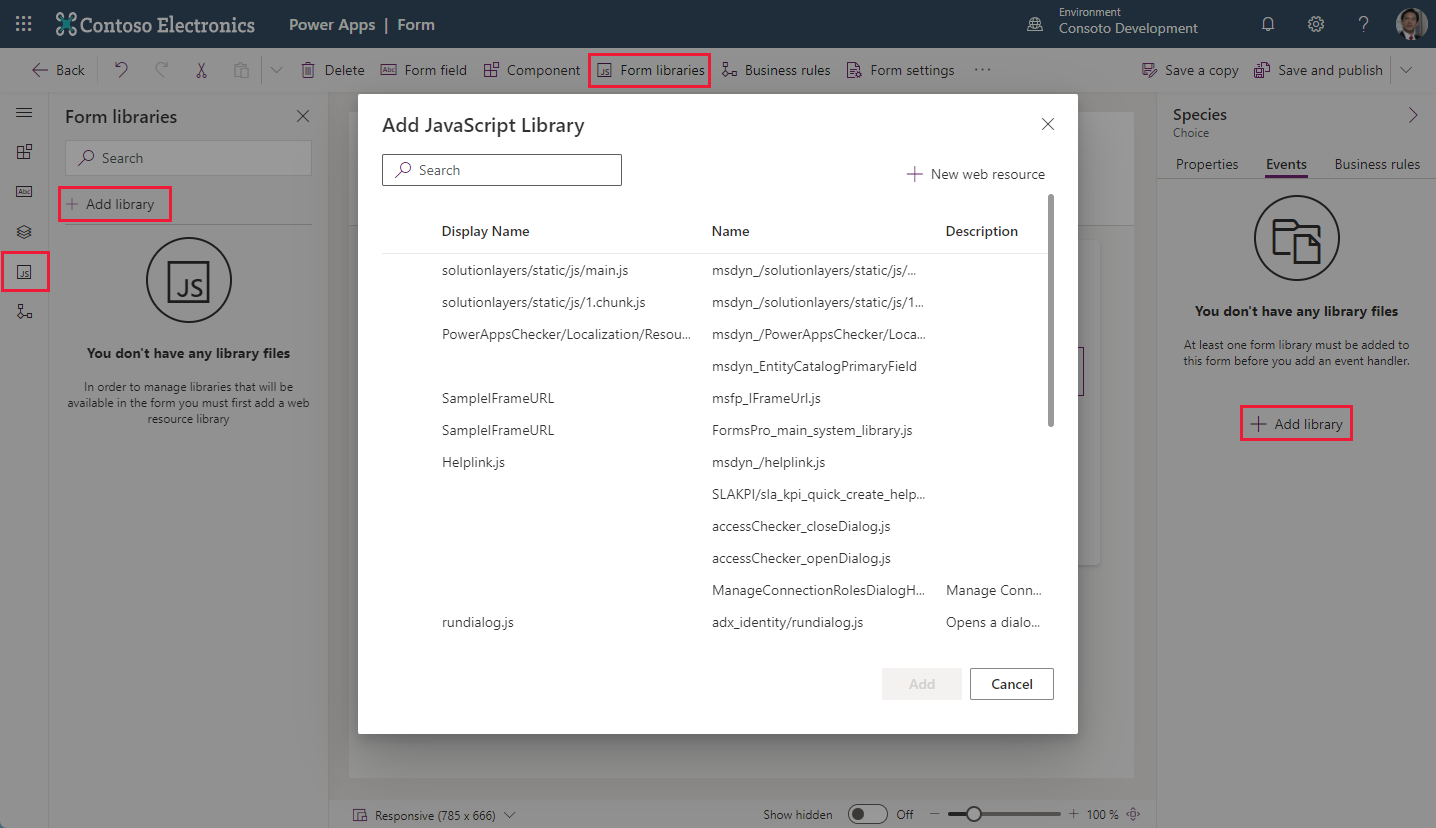
You can load event handlers into your form via the Add library tab in the left margin menu, selecting + Add library from the Form libraries menu and then searching for or selecting the JavaScript library you wish to add.
The Power Apps Form designer provides you the ability to create and control every aspect of your form through fields, components, settings and event handlers. You can design a basic non-visual form. Or you can design forms that will adjust to the security role of the user, run scripts during user interaction, and provide graphic interface with data.
In the next unit, we'll explore how to configure multiple forms.
Configure multiple forms
100 XP
5 minutesUsers of model driven applications will encounter many forms in their user experience, and will even encounter different forms for the same table depending on their role, job tasks, and desired outcomes.
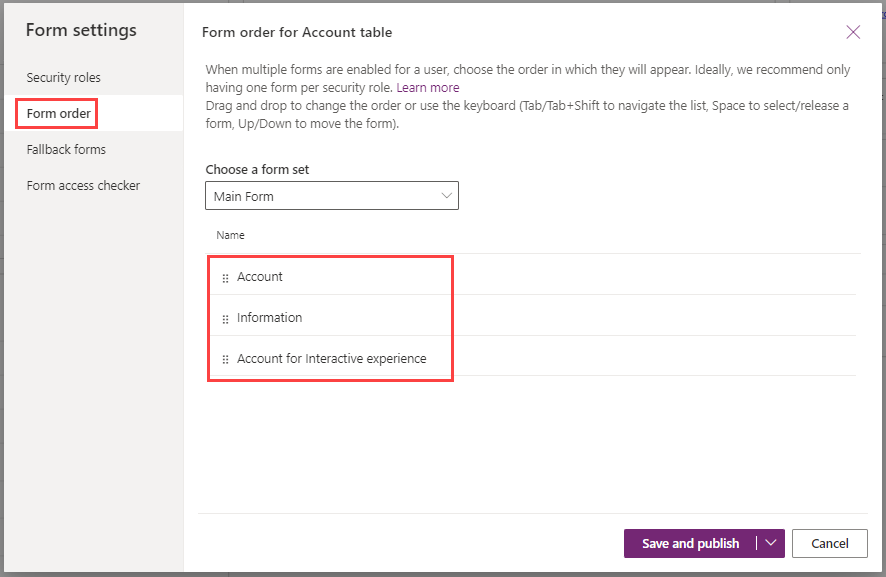
You can set the form order when using multiple forms. Form order defines the order in which a user sees the available forms, within the set of allowed forms for their security roles.
The Form settings give you the ability to choose a form set from the dropdown and then allow you to drag and drop to change the order of the forms. To save the reordering, press the Save and publish button.
Access to forms
When users need to access common tables for different roles, it might be useful to have other forms available to tailor the user experience for that particular set of users. You can assign a security role (or collection of security roles) to control access to the form. For example, you may have a set of users who focus on sales and have customizations to the Contact row such as the addition of LinkedIn Sales Navigator widgets. For a non-sales user this would make for an undesirable experience, with loads of unnecessary blank areas on the Contact form. You could copy the main contact row and then add or remove the components to the copy, and then assign security roles to each of the forms.
Note
Controlling user access to forms is not necessarily a secure means to prevent access to data. Sometimes users have other ways to interact with data such as advanced find or background automation.
Form types and behaviors
Main - Main forms are the primary user interface where people view and interact with their data. Main forms provide the widest range of options and are available for model-driven apps. One of the fundamental qualities of model-driven apps is that they're responsive to the size and type of device used when interacting with them. This affects the position of the controls on the form in addition to the way in which they behave. This is most notably the case with main forms. One of the main design objectives for main forms is that you design them once and deploy them everywhere. The same main form you design for a model-driven app or the customer engagement apps web application, is also used in Dynamics 365 for Outlook and Dynamics 365 for tablets. The advantage to this approach is that you don’t have to integrate changes into multiple forms. AutoSave is the default behavior on main forms but can be disabled by administrators.
Quick create - With quick create forms, an app can have a streamlined data entry experience with full support for logic defined by form scripts and business rules. In a Power Apps model-driven app, quick create forms appear when the Create button is selected in the navigation bar or when + New is chosen when creating a new row from a lookup or subgrid. Model-driven apps and Dynamics 365 mobile apps use quick create forms for creating new rows. If a table already has a quick create form configured for it, the mobile apps use that form. If a table doesn't have a configured quick create form, Power Apps generates a quick create form for creating rows in the mobile apps based on the main form definition.
Note
Although it is possible to create quick create forms for system activity tables (except for the appointment table), they do not support quick create forms. Currently, the option to disable the quick create form for the appointment table is not supported. Any of the other updated tables and any custom tables can be enabled to support these forms by selecting Enable quick create forms in the table definition and creating a quick create form for the table.
Quick view - A quick view form can be added to another form as a quick view control. It provides a template to view information about a related table row within a form for another table row. This means your app users don't need to navigate to a different row to see the information needed to do their work. Quick view controls are associated with a lookup column that is included in a form. While a quick view form can appear over a view or a form, it's authored as a form, rather than a view. If the lookup column value isn't set, the quick view control won't be visible. Data in quick view controls can't be edited and quick view forms don't support form scripts.
Card - Card forms are used in views for model-driven apps. They're designed to present information in a compact format that is suitable for mobile devices. Although card forms can be created and edited in the same way as other form types, card forms are added to apps differently. Instead of adding a form as an app component, custom card forms are added to views by using the Read Only Grid control.
Miscellaneous form details
Each table must have a designated fallback form. This is the form that all users would see if they don't have a security role assigned that matches your role-tailored forms. Fallback forms are only available with main forms and don't apply to quick create, quick view, and card forms.
When a user has access to multiple forms, a form selector will be available near the top of the form. If a user has access to only a single form for a given table, there will be no form selector visible.
You can designate a main form as inactive. This will make it not visible to all users, regardless of security roles. This feature was included primarily to manage new forms included when organizations upgrade but you can use it to prevent people from being able to use any main form.
Being able to configure your forms is an essential skill for a model-driven app developer.
Use specialized form components
100 XP
7 minutesPower Apps provides controls for model-driven apps that allow users to visualize data within table columns in addition to enabling interaction with them. This unit contains more details on several of the most common ones.
Grid controls
Grid controls are configurable for a Table or a Form as a read-only subgrid, and editable grid, or as a Power Apps grid control (preview). The read-only subgrid allows you to present a view of data related to the current record where users can view and open the record from within the grid. Editable subgrids allow users rich in-line editing of records directly from views and subgrids whether they're using a web app, tablet, or phone. The Power Apps grid control represents the next evolution of the Power Apps grid control, allowing users to view, open, and edit records from views and subgrids. By default, the Power Apps grid control is read-only, but you can configure it to be editable.
Display controls
Display controls provide you the ability to display information in your app that isn't directly related to table data. Examples include the Calendar control, which allows users to view scheduled activities and their associated details in a calendar, or an embedded Canvas app, which enables rich data integration of various data sources right next to contextual data from the host model-driven form. A web resource such as an HTML page or image file is another display control. Another is a Knowledge Base Search control (which requires Dynamics 365 Customer Service app) to make it easy for users in your organization find knowledge articles so they can answer common customer questions and resolve their issues right from the records, without having to switch to a different application. Other Display controls include the following:
IFrame
You can add inline frames (iFrames) to a form to integrate content from another website within a form. iFrames can be added to the modern experience by inserting an External website display control onto the form. To learn more about that, see Add an iframe to a model-driven app main form.
Quick view
A quick view control on a model-driven app form displays data from a row that is selected in a lookup on the form. The data displayed in the control is defined using a quick view form. The data displayed isn't editable, but when the primary column is included in the quick view form, it becomes a link to open the related row.
Timeline control
The timeline helps app users see all activity history. The timeline control is used to capture activities like notes, appointments, emails, phone calls, and tasks. It ensures that all interactions with the related table are tracked and visible over time. Use the timeline to quickly catch up on all of the latest activity details.
The timeline control provides an easy way to view information related to a table, such as accounts or contacts. This immersive experience helps give users a better understanding of their customer interactions, and helps them deliver more personalized service in an efficient and effective manner.
App makers can configure the information displayed on the timeline to help users access information and create new activity records, such as emails and tasks directly from the timeline quickly so they can deliver more personalized service.
Input controls
Input controls provide the means for users to input data. Among these controls are the Checkbox, which allows users to choose between binary values, Number input which allows users to tap plus and minus buttons to change a numeric value in configurable increments (or type a number directly into the control), and the Option set which presents a set of choices for users to choose from during data entry. Other input controls include the Pen input as a means to capture written input as signatures, the Rich text editor which provides an editing area for formatting text, and the Star rating and Toggle controls.
Summary
These are just some of the options available for customizing your model-driven apps forms experience. To learn more about the available controls for model-driven apps forms, see List of controls available for model-driven apps.
Configure views overview
100 XP
5 minutesThis video discusses how to configure views for model-driven applications for Dynamics 365.
Configure grids
The Power Apps grid control allows users to view, open, and edit records from views and subgrids. In addition to inline editing, the control provides other capabilities. Capabilities include:
A modern data browsing experience via infinite scrolling, allowing users to scroll indefinitely through data until they find the records they're interested in.An ability to customize the visual appearance of columns for specific needs.To add the grid control to views for a table, select Solutions from the Power Apps maker portal. You can look for and select your solution under Solutions. A good place to start is your Common Data Services Default Solution, if you don't have a solution already built.
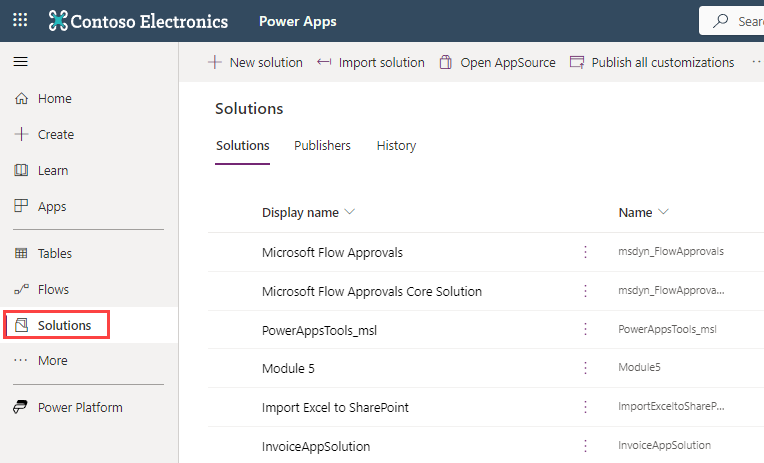
Inside of the Solution you see a view of the Objects that are part of the solution. These objects include Apps, Chatbots, Choices, Cloud flows, Dashboards, Site maps, and Tables. To begin using the grid control, we need to find an app that is in your solution. You can quickly sort your Objects by selecting Apps to display all of the apps that are part of the solution.
Note
If you do not have a model-driven app in your solution, you will need to create one before continuing. Please see the instructions on how to build your first model-driven app.
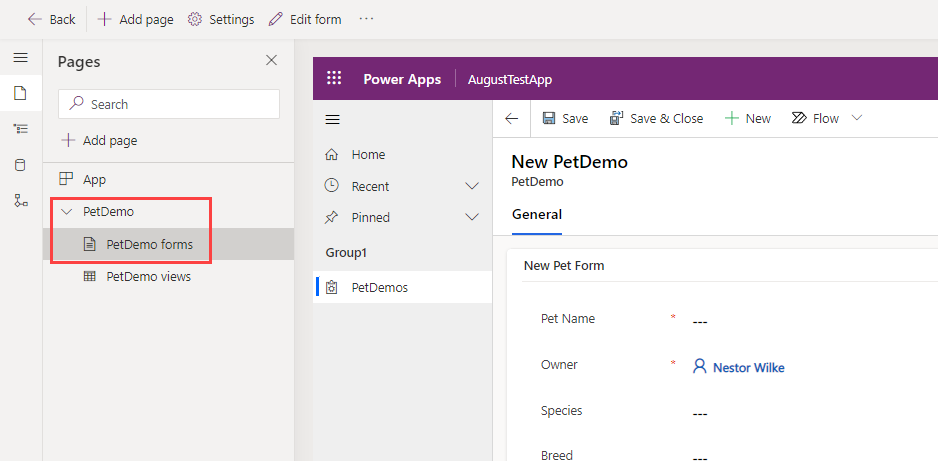
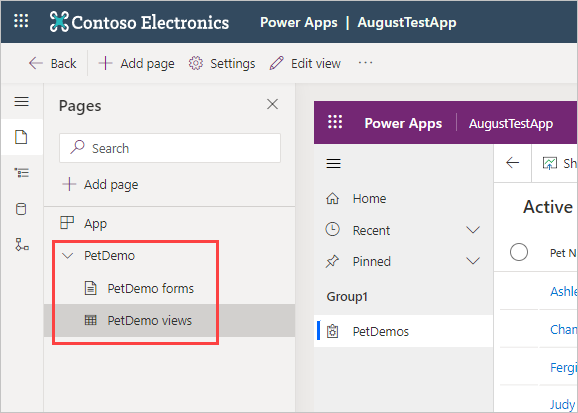
Once you've selected your app, we need to get to the form editor for your model-driven app. When your app opens, you see the home screen of your app in the canvas area. On the left side of your screen is a Pages panel with the names of any tables that are connected to your app. Select the table name to expand it. In the example below, we have selected our PetDemo table, and we're going to select Pet forms.
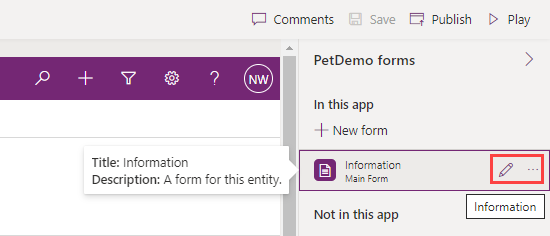
On the right side of your screen is a panel showing the forms already part of this app. When you hover your mouse over the name of your form you see an Edit pencil appear (if you don't see that, you can select the ellipsis next to the form name). Select the icon to edit your form.
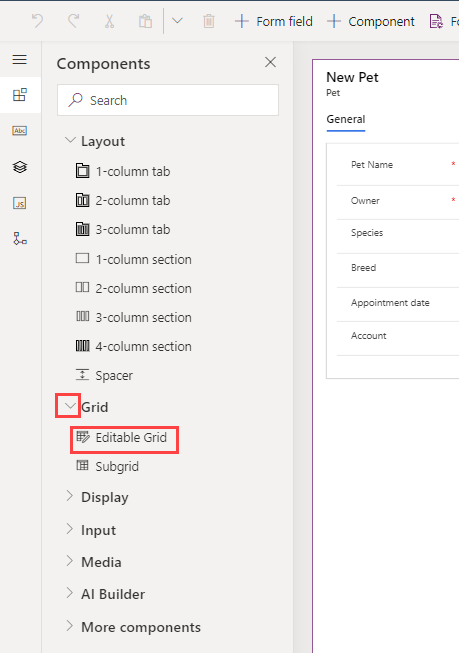
This action opens up the form editor. In your form edit canvas, select the area of the canvas where you wish to place a grid control. Then select the Components menu from the left navigation pane and expand the Grid option. Select Editable Grid.
In the pop-up pane called Add Editable Grid, you can select the table you want to link to this control. There are other options you can pick, such as the View or Layout. If you scroll all the way down the pane, you can select which device this component appears on including Web, Mobile and Tablet. When you're satisfied with your choices, select Done.
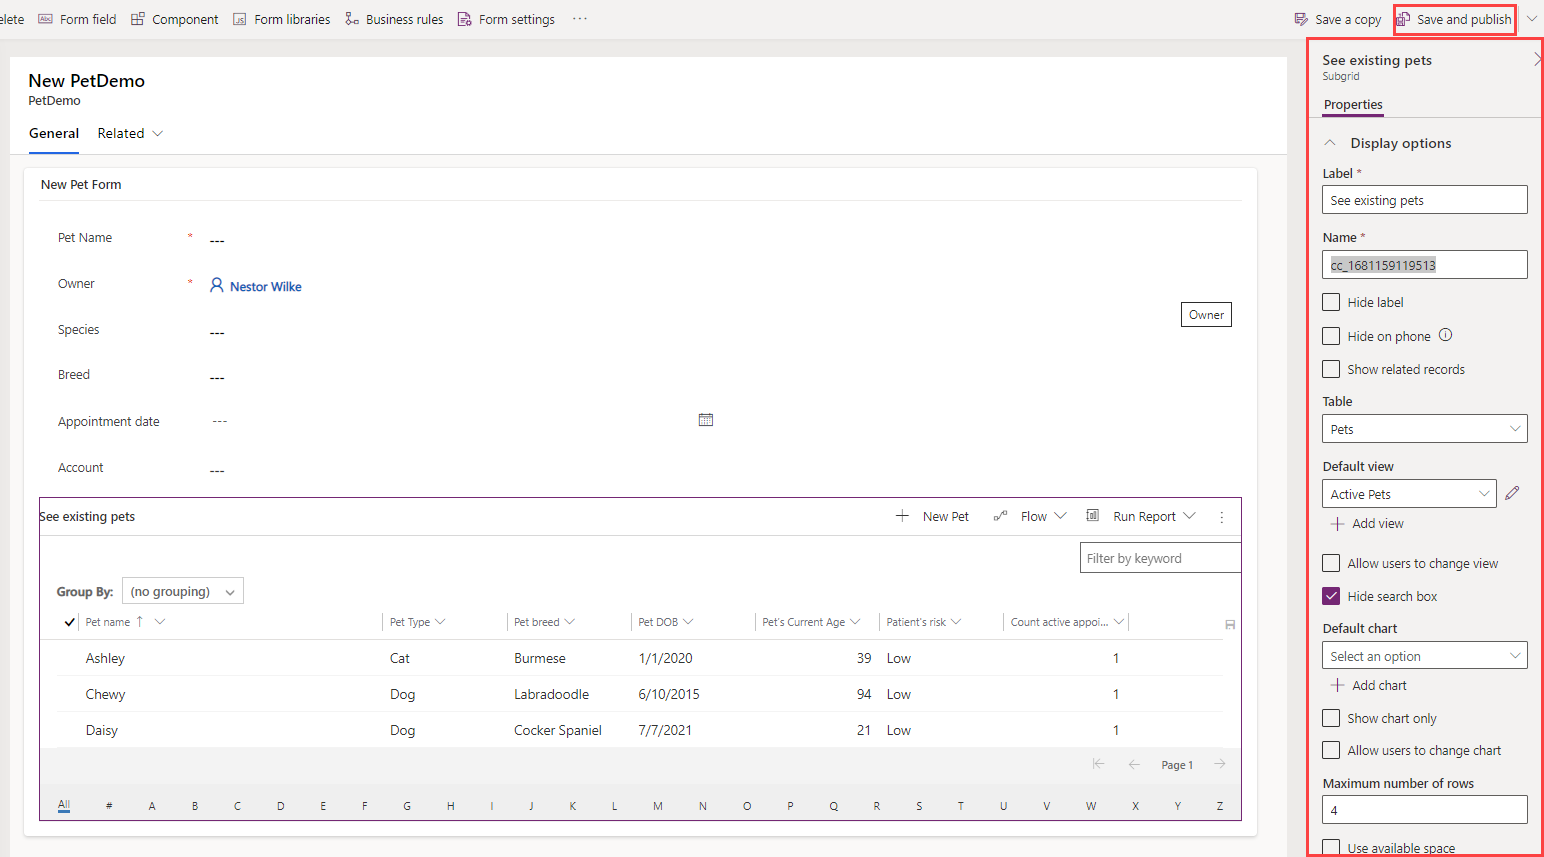
Your new editable grid appears on the form canvas. See how the properties pane appears to the right of your form canvas, with numerous customizable options. Once you're satisfied with the settings, you can Save and publish to record the changes.
To return to your model-driven app, you can select Back from the top left of the command ribbon.
Use specialty views
Model-driven apps use views to define how a list of records for a specific table are displayed in an application.
A view defines:
The columns to displayThe order of the columnsHow wide each column should beHow the list of records should be sorted by defaultThe default filters applied to restrict the records that appearHere are the types of views with a brief summary of each:
Public views - Public views are general purpose views that you can customize as you see fit. They're important because all app users can access them, when they're made available, by using the view selector. It's possible to use public views in subgrids in a form or as a list in a dashboard.
System views - As a system administrator or system customizer, you can edit system views. System views are special views the application depends on, which exist for system tables or are automatically created when you create custom tables. These views have specific purposes and some extra capabilities.
Inside each app, users can select from a dropdown list of available views that include these views.
Public views
Some public views exist by default for system tables and for any custom table. When you create a new custom table, you have a combination of public (active and inactive views of your table) and system views (including the four system views).
Additionally, users can create custom public views. Users can also delete any custom public views they've created in an unmanaged solution. However, any system-defined public views can't be deleted.
You can use the following technique to create/manage a public view within your model-driven app.
From the Power Apps maker portal, select the Solution where your app resides. Then select your app.
Note
You cannot create/edit a view within a managed solution. Ensure that the app you want to create/edit a view is not in a managed solution (In your Solutions table, look for the column with the header Managed and select one with a value of No.)
Your app opens in the app editor. From the Pages panel on the left side of the screen look for the table that you want to create/manage a view in and select it. Immediately, you see the table name expand with forms and views menu options displayed below the table name.
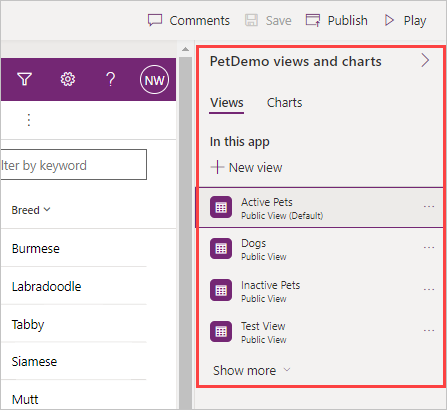
Select the views option below the table name and you notice that the Views properties pane on the right side of your screen shows all of the public views of this table that are currently in this app are displayed. Notice that one of your views will be marked Default view, and that is the one displaying on the designer canvas.
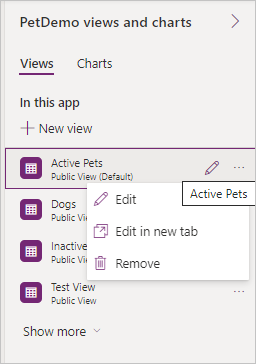
As you hover over the existing tables, you notice an edit icon appears next to the ellipsis, and selecting this takes you to the view editor. You can also select the ellipsis and you see other manage view options to *Edit, which opens the view in your current browser tap, Edit in a new tab and Remove which deletes the view.
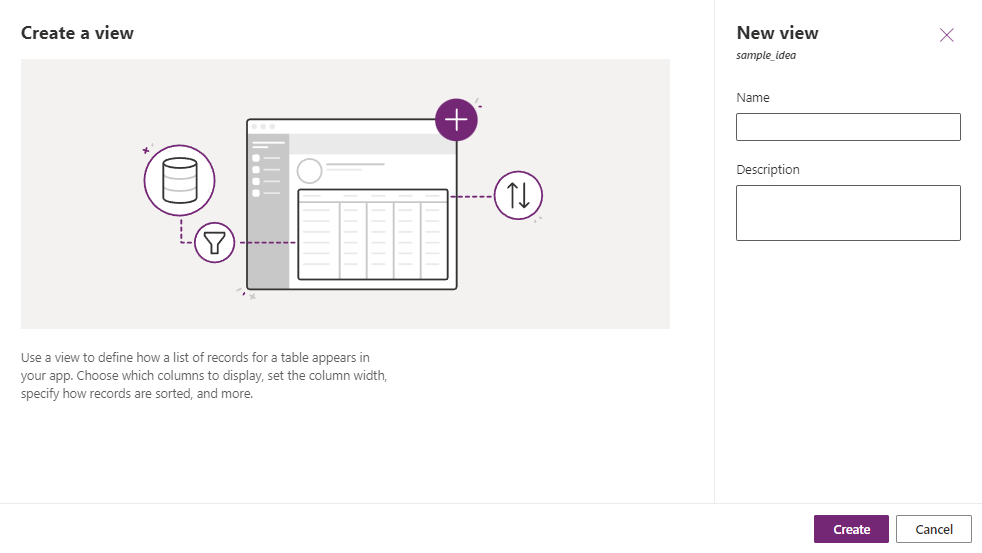
Since the view editor is the same whether you're selecting an existing view or creating a new one, Let's create a new one. Select + New View inside your Views pane. In the popup window for the new view, add a name and then select Create.
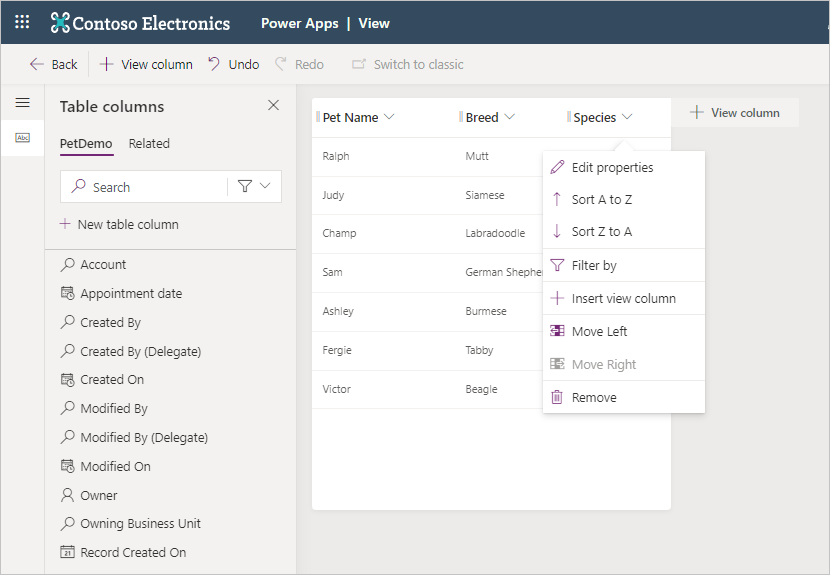
Notice that your view is based on the same data table and your new view shows the primary name column. In the Table columns pane on the left side of the screen you can select columns to add to your view just by clicking on them. You can also select the + View column button in the table header within the view canvas. You can drag and drop columns to change their positions within the header row of your view. Go ahead and add a couple of columns into your view so you can see how it functions. If you don't like your selection, there's an Undo button in the command ribbon or you can select the column name in the header to see some options including Remove. In the example below, we've added Breed and Species. We have also selected Species to show you the different options available for this column.
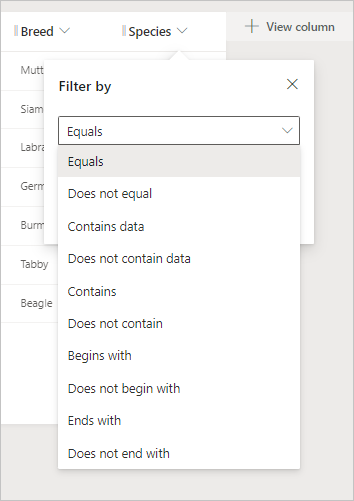
To filter your view, you can select any of the columns in your view. In the dropdown menu, you see Filter by about halfway down the list. Select a column you wish to filter your view by and then select Filter by. Notice that a popup appears with two dropdown options for your filter. The top dropdown gives you a menu of conditional choices such as Equals, Contains and Begins with.
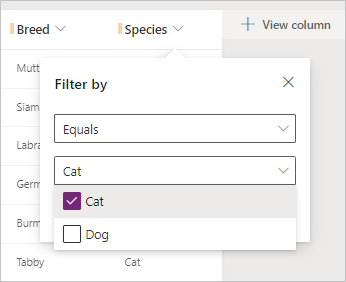
The second dropdown provides you with the opportunity to choose a value from the selected column to use in your filter condition. You notice a checkbox next to each value, so you can select the one to use in your filter condition. Then select the Apply button (below the column value field) to record the filter.
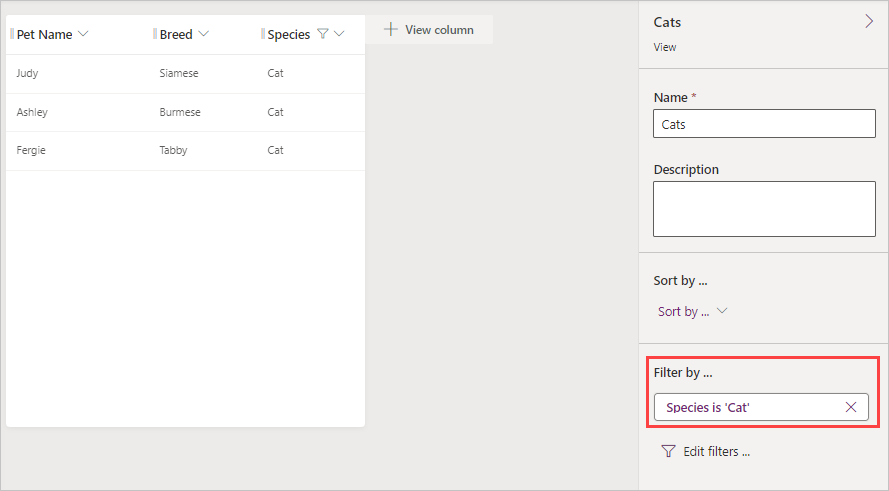
After applying your filter, the view in your view canvas will re-render with the new filter applied. Also, in your view properties pane on the right side of the screen, you see Filter by... with your filter condition listed under it.
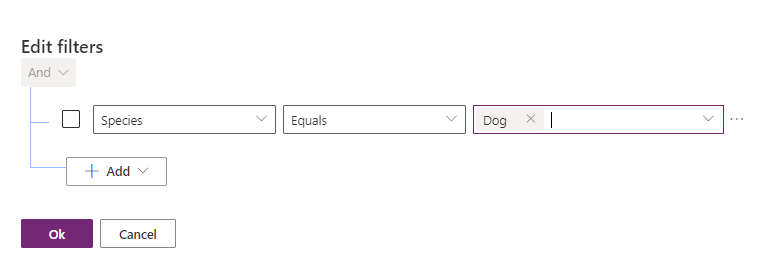
You can have multiple filters in your view, and you can even apply them to the same column. You can add more filters by employing the same method we demonstrated above (in selecting the column header). Or you can select the Edit filters... from the properties pane to add other conditions window. When you select the Edit filters... option, a popup window appears where you can add other conditions to filter your view.
When you're satisfied with your view, select Publish from the top right of the command ribbon. This saves the view and makes it available for other users in your organization.
System views
System Views for your table aren't immediately shown in the view selector, and you can't use them in sublists in a form or as a list in a dashboard. You can't delete or deactivate these views. They're owned by the organization, so that everyone can view them. Here are the different types and how they're used.
| Quick Find | The default view used for searches performed using Quick Find. This view also defines which columns are searched when using the search capabilities of Quick Find and Lookup views. |
| Advanced Find | The default view used to display results when using Advanced Find. This view also defines the columns used by default when new custom public views or personal views are created without defining a view to use as a template. |
| Associated | The default view that lists the related tables for a record. |
| Lookup | The view that is displayed when you select a record to set for a lookup column. |
You can find and explore these views in your app by selecting the Show more from your Views property pane on the right side of the screen.
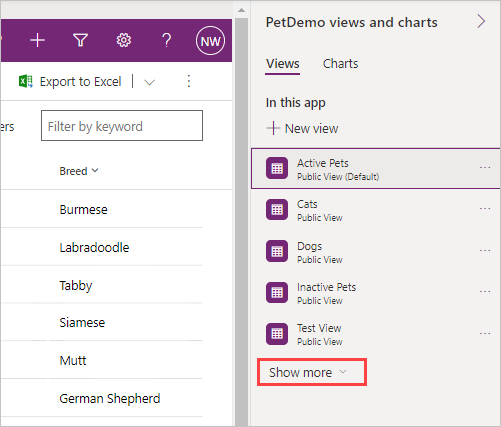
Notice how all four system views appear in the list. Remember, if you're a system administrator, you can edit these views just like you would a Public view.
For more information, see Understand model-driven app views.
Configure charts overview
Charts provide an interactive view of data. This video provides an overview of charts.
Dashboards overview
Dashboards are used to show several areas of an application in a single display. Watch the video for an overview of dashboards.
Use interactive streams and tiles
Interactive dashboards are a one-stop workplace for app users to view real-time information and take action. They're fully configurable, security-role based, and deliver workload information from multiple inputs. Interactive dashboard users don't need to page through the application looking for a particular row; they can act on it directly from the dashboard.
Dashboard types
The interactive experience dashboards come in two forms: multi-stream and single-stream. Additionally, multi-stream dashboards can be home page or table-specific dashboards. The table-specific dashboards are configured in a different part of the user interface and partially preloaded with the table-specific configuration information.
Multi-stream dashboards
Multi-stream dashboards display data in real-time over multiple streams. There's no limit on how many streams you can configure on the dashboard. The data in a stream can be based on a single table, but each stream can be based on a different table.
In the multi-stream dashboard, you see a row of visual filters at the top with data streams below them. You also have the ability to hide your visual filters by toggling the Hide Visual Filter option from the screen header.

Multi-stream dashboards also provide a tile view, which you can toggle by selecting the Switch to Tile View button on the command bar. This option toggles stream data into being displayed as interactive summary tiles that display the count of rows within each stream. The button Switch to Stream View is what the toggle looks like on the tile view.
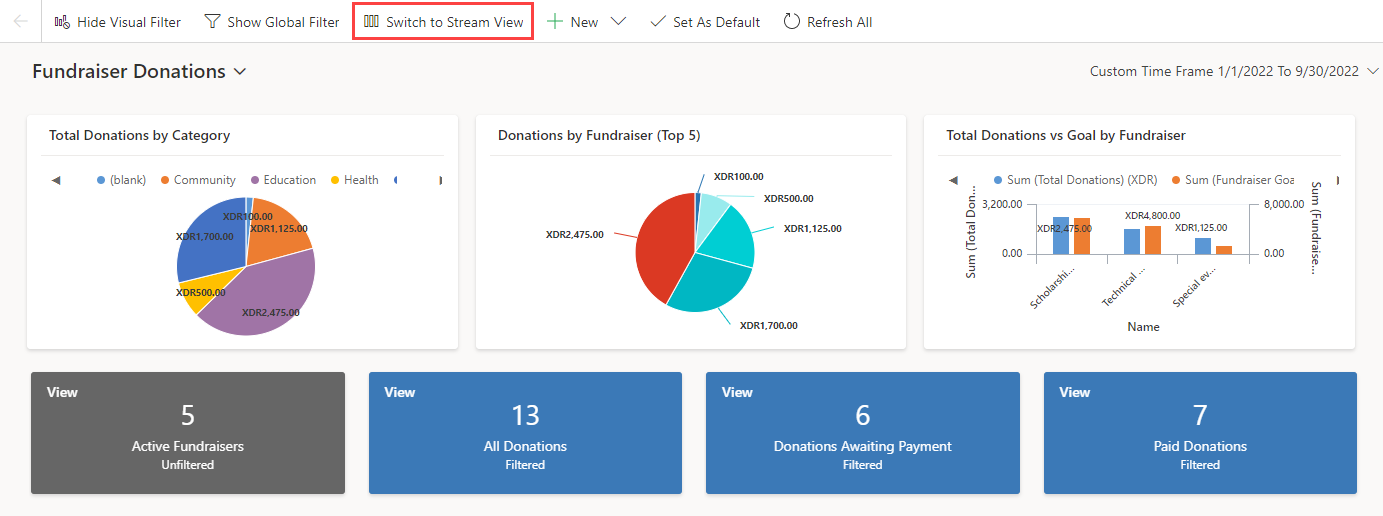
The tiles contain interactive charts that are referred to as Visual Filters. These charts display counts of relevant rows, and you can filter data contained within the dashboard by selecting different values contained within the charts.
Single-stream dashboards
Single-stream dashboards display data in real time over a single stream based on a table view, with the visual filters already applied. They enable a more detailed view of a given table, and as such are good for monitoring smaller but more complex data. This dashboard type always displays tiles and places them on the right side of the screen.

Interactive tiles
Interactive tiles are useful for providing summarized insights about your data. Using interactive tiles, you can:
Show aggregated view of data across queues/views
Select tile to drill to underlying rows
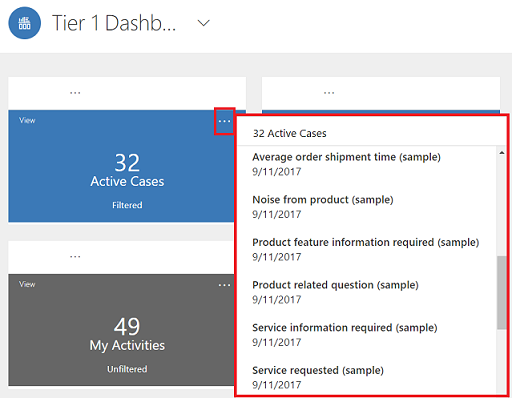
The content of each tile represents the count of the number of rows within that given stream. Hovering over the "View" text will show you from which view the tile's stream is being pulled. Selecting a tile will produce a flyout of the rows contained in the stream, which you're able to navigate to by selecting a given row.
Configuring interactive dashboard columns
To configure your dashboard, from the Model-driven app editor Pages menu, expand your Dashboards section and select the dashboard that you want to modify. Then select the ellipsis to the right of the dashboard name and select Edit. This will take you to the dashboard editor.
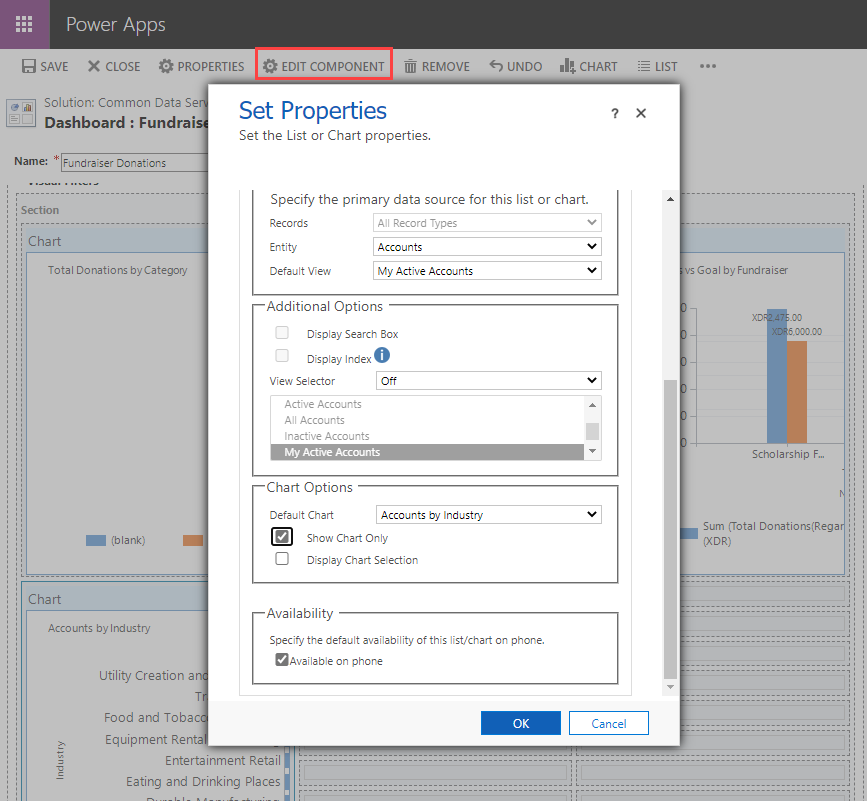
Within the dashboard editor, you can adjust the properties of any element by selecting the element and then selecting Edit Component in the command bar. A Set Properties pop-up enables you to tweak your component's properties.
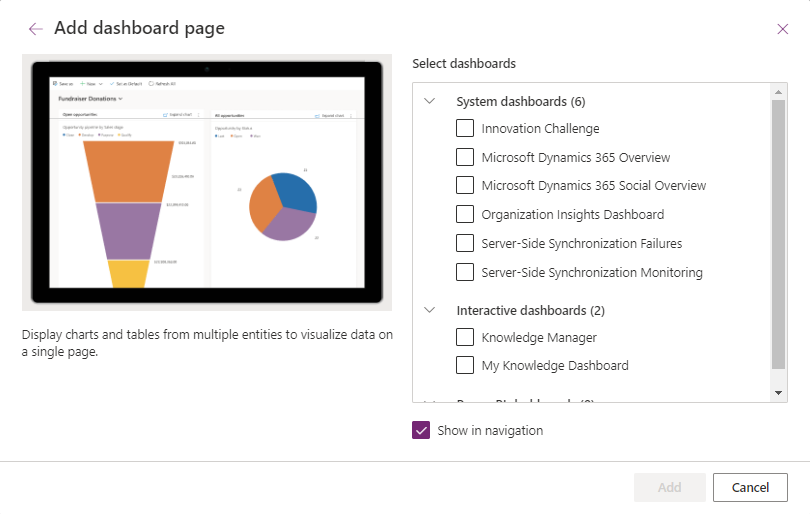
If you wish to add an already created dashboard to your app, from the Model-driven app editor screen, select + Add page from the command bar. Then from the Add page pop-up window select Dashboard and then Next. The Add dashboard page allows selection of the dashboard you wish to add.
Composing custom-interactive dashboards
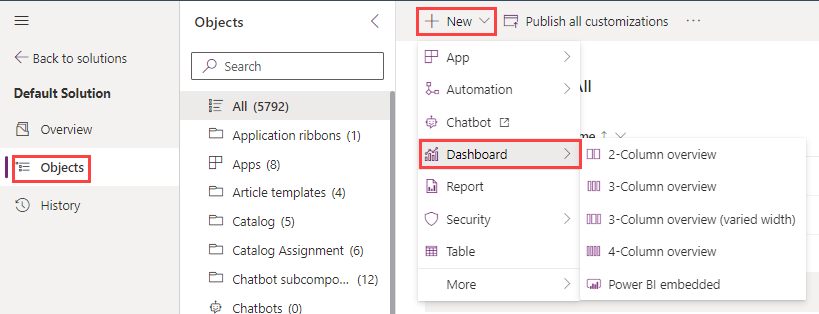
To compose a dashboard, you'll need to select Solutions from the maker portal home screen. Select your solution and then the Objects tab. From the + New drop-down in the command bar, select Dashboard, and then select from one of the options regarding the number of columns or Power BI embedded.
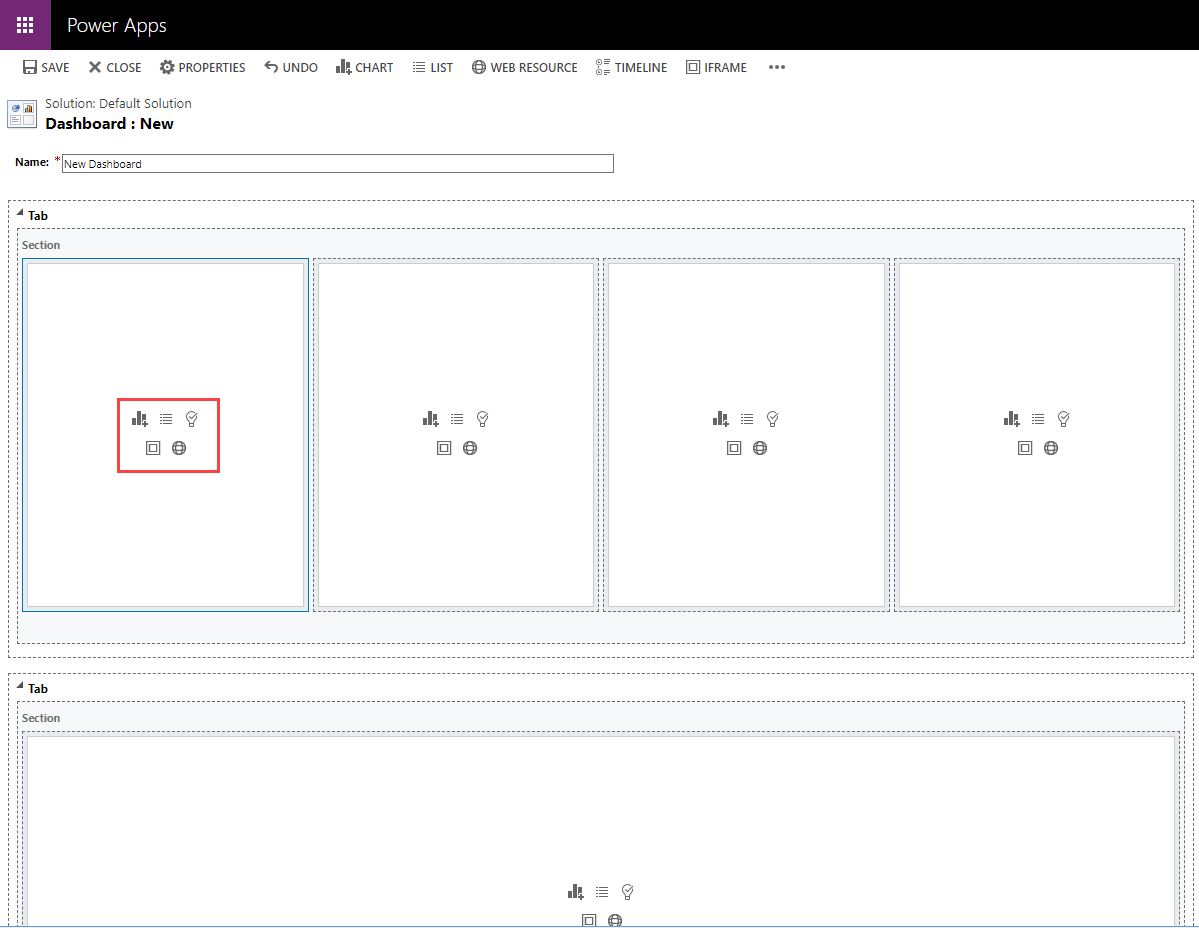
The Dashboard: New screen will appear in a separate browser tab. The layout will match the option you selected previously, but all of the sections will be blank with a series of icons enabling you to insert a chart, list, assistant, Iframe or Web Resource. You can also insert items from the command bar.
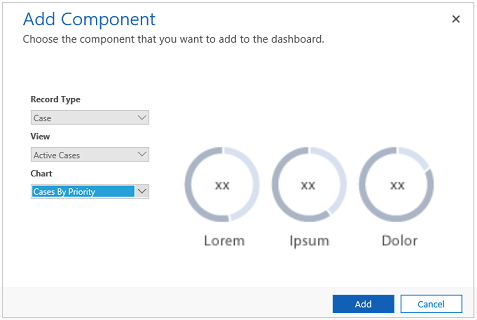
Selecting Insert Chart from the icons will cause the Add Component dialog window to appear. You can select it to add interactive charts to your dashboard. You can select the record, view and chart that you want to depict, and a preview appears on the right of the window.
Similarly, selecting Insert list presents the Add Component menu with options to select which list to add to your dashboard. Insert assistant is only available for one tile in your dashboard. Insert IFRAME will give you a dialog window to add an IFRAME and Insert Web Resource prompts a dialog window to add a web resource.
Once you're finished editing your dashboard, you can save and close it to go back to your app edit screen where you can insert your new dashboard into the app.
For more information, see creating and configuring model-driven app interactive experience dashboards.
Check your knowledge
Answer the following questions to see what you've learned.
If you need to display form data on a dashboard, what form type should you use?
Quick view
Use the Quick View form type to display form data on a dashboard.
Main
Card
Quick create
Which of the following isn't an available control for customizing a model-driven app?
Grid control
Inline frame (IFrame)
Scale
Correct! A scale isn't an available model-driven app control.
Pen input
What is an editable grid?
A form used to display a dashboard.
A function to create new fields.
A specific form type that can be used to edit and create new fields.
Special controls for editing select fields from a view without having to open the specific record.
An editable grid is a special control for editing fields from a view without opening the record.


 Bengali (Bangladesh) ·
  English (United States) ·